
Objective: Through the
daily transaction data, compute the shares rising for 5 consecutive days from
29 blue chips.
Train of Thoughts: Import
data; Filer out the data of previous month; Group by the code of shares; Sort
the data by the date; Calculate the daily increment of the closing price based
on the comparison to that on the previous day; Calculate the days of
consecutive positive growth; Filter out the shares whose positive rising days
are greater or equal to 5.
Row data: Downloading the
transaction data of shares about the major blue chips from a financial website.
They are more than 29 listed public companies and put the data in Excel:

esProc
Solution

A1: Retrieve data from Excel. The whole process will take about 20-30
seconds. After all, there are more than 200 thousand rows of data in total.
A2: Filter the data by date. Only need the transaction data in a
month.
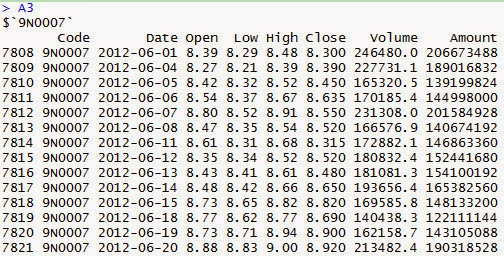
A3: =A2.group(Code) is to group by the code of shares. This is similar
to the split function of R, and you can view the calculation on the right by
clicking on this cell:

Each row is a group, and you can view the
data in the group by clicking one of the rows:

A4: =A3.(~.sort(Date)), to sort the transaction data of the shares of
each company by transaction date.
This is because whether the downloaded data
having been sorted in advance is not confirmed and the inter-row computation
followed can only be conducted on the sorted data.
A5: =A4.(~.dup@t()), to structuralize
the data (the TSeq in esProc) to add the new column dynamically in the next
steps.
A6: =A5.(~.derive((Close-Close[-1]):INC)) to calculate on the shares of
each company through ”Closing price today”-“Closing price previous day”.
This
is a newly-appended column with the name “NC”. It is quite obvious that INC
above 0 indicates the shares price is rising, and below 0 indicates the shares
price is on decline.
A7: =A6.(~.derive(if(INC>0,CID=CID[-1]+1,0):CID)) to add a new column
CID to record the consecutive rising days to this date.
If the shares price is
rising (INC>0), then add 1 to the CID of the previous day as the CID of this
day; On the contrary, if the shares price is dropping, then the CID of this day
will be reset to 0.
A8: =A7.select(~.max(CID)>=5) to filter. If the greatest consecutive
rising days of a certain shares are equal or greater than 5, then it is the
shares of good quality. The symbol of ~ represents every group (i.e. shares of
every company). In this way, most loop statements become unnecessary.
The
result is shown below:

A9: =A8.(~.Code) to retrieve the code of company shares, that is, the
Code in each group. The result is shown below:

R Solution
01 library(gdata)
#use excel function library
02 A1<-
read.xls("e:\\data\\all.xlsx") #import data
03 A2<-subset(A1,as.POSIXlt(Date)>=as.POSIXlt('2012-06-01')
& as.POSIXlt(Date)<=as.POSIXlt('2012-06-30')) #filter by date
04 A3
<- split(A2,A2$Code) #group by Code
05 A8<-list()
06 for(i
in 1:length(A3)){
07 A3[[i]][order(as.numeric(A3[[i]]$Date)),]
#sort by Date in each group
08 A3[[i]]$INC<-with(A3[[i]],
Close-c(0,Close[- length (Close)])) #add a column, increased price
09 if(nrow(A3[[i]])>0){ #add a column, continuous increased days
10 A3[[i]]$CID[[1]]<-1
11 for(j in 2:nrow(A3[[i]])){
12 if(A3[[i]]$INC[[j]]>0 ){
13
A3[[i]]$CID[[j]]<-A3[[i]]$CID[[j-1]]+1
14 }else{
15 A3[[i]]$CID[[j]]<-0
16 }
17 }
18 }
19 if(max(A3[[i]]$CID)>=5){ #stock max CID is bigger than 5
20 A8[[length(A8)+1]]<-A3[[i]]
21 }
22 }
23 A9<-lapply(A8,function(x)
x$Code[[1]]) #finally,stock code
01: Enable the support for Excel. Please note that third party package
is required for R to support Excel. Therefore, it is not easy to find a compatible
package.
02: Import the data from
Excel. Perhaps this downloaded package is not working very well, this procedure
takes about 8 - 10 minutes. The memory taken by Perl is several hundreds
megabytes more than that of esProc. Despite it, the operation speed of R itself
is actually quite high and the performance of retrieving the data from database
well proves it.
03, 04: Filter by date,
and group by Code. Seeing the grouped data, you may find it a bit hard to
understand. After clicking the variables on the right, the result will be as
shown below:

It will
be even better if inputting commands on the console directly, as given below:
05: A8<-list() to
define a variable A8 of list type, which will be used to store the shares
rising for 5 or more days.
06-22: Because R does not
allow for using ~ to represent the operation on each group like we do in
esProc, a big loop is unavoidable, and each loop is aimed to calculate for the
shares of one company.
07: Sort by date. If
sorted before grouping, the code would be simpler. The most intuitive situation
in my mind is that data is mixed up before grouping and you can not determine
if they are sorted.
After grouping, you will find that the order is a bit messy
and the inter-row calculation in the next step cannot be conducted if not
sorting.
08: Add a column INC to calculate the “Closing price this day”–“Closing
price previous day”. R does not support the inter-row calculation. Therefore,
move the whole section of closing prices downward by one row, and then substrate
the original closing price. The code is: Close-c(0,Close[- length (Close)]).
09-18: Add a column CID to calculate the consecutive rising days. The if(nrow(A3[[i]])>0)
in the row 09 is to avoid the error of null pointer resulting from any shares without
any data due to the temporary suspension or other reasons.
The A3[[i]]$CID[[1]]<-1
in the row 10 is to assign the initial value and avoid the error of null
pointer followed. esProc does not require users to carry out any similar tests
and is more friendlier to the non-technical and professional personnel than R.
11-17: Calculate the consecutive rising
days. Although the necessary codes are not a few, the algorithm is same to that
of esProc.
19-21: Filter. If the
longest consecutive rising days of a certain share are equal or greater than 5,
then it is the shares of good quality. Though there are quite a few lines of
codes, the algorithm is quite different to the esProc. The result is as shown
below:

23:Get the code from the
group, A9<-lapply(A8,function(x) x$Code[[1]]), as shown in the below figure:

Findings:
Both R and esProc can implement some rather
complex shares analysis with its own capability. The code of esProc is simpler
and easier-to-understand and thus it avoids most loop statements. The user-friendly
esProc mechanism and process has been setup for the aspect in which the error
may easily occur. Generally speaking, you will know how to analyze shares with
esProc as long as you know how to use the basic Excel formulas.
To complete the shares analysis with R,
users must be skilled in programming and have learned some mathematical
knowledge so as to implement every function of R flexibly. R also has the
outstanding scalability, for example, the 3rd party library function and statistical
chart for stock markets; for another example, R allows users to write a
function to retrieve the Excel data more efficiently.
more: http://blog.raqsoft.com
No comments:
Post a Comment