
It’s
hard to create reports with unconventional layouts directly with functions
provided by a reporting tool. However, if the data for building such a report
can be beautifully prepared, the difficulty could be considerably reduced.
esProc(free
edition is available) is an expert at handling this data preparation. It
provides set operations, supports dynamic script execution, as well as offers a
handy JDBC interface through which the reporting tool gets the result of
executing the esProc script, which will be identified as a database stored
procedure and accept parameters from the reporting tool.
Below is
structure of integration of an esProc script and a reporting tool:

An example ofcreatinghorizontal multi-column layoutusing esProc:
Most
reporting tools support vertical layout but they are really not good at
arranging records horizontally in multiple columns. Below is a selection of the
database table emp,which has three fields:
|
EId
|
Name
|
Dept
|
|
4
|
Emily
|
HR
|
|
5
|
Ashley
|
R&D
|
|
6
|
Matthew
|
Sales
|
|
7
|
Alexis
|
Sales
|
|
8
|
Megan
|
Marketing
|
|
9
|
Victoria
|
HR
|
|
10
|
Ryan
|
R&D
|
|
11
|
Jacob
|
Sales
|
The expected layout puts records continuously in 3 columnsin a “the horizontalfirst” order, as shown below:

By transforming the original 3-column table to a 9-colulmn table with esProc, you can create a horizontal layout directly with the reporting tool. Below is the esProc script:

A1:Execute an SQL statement, in which both
begin and end are report parameters.
A2:Create a new two-dimensional table by retrieving
the first record every three ones from A1. B2 and C2 do the same thing in the
same manner. It’s possible that B2 and C2 have one less record than A2, so you
need to append a null record to each of them. The operator “|” means concatenating
two sets. The result is:
A3: Join B2 and C2 with A2. B2(#).EId is the first newly-added field, meaning getting EId field of the #th record from B2. The sign “#” stands for the sequence number of each record of A2. The result is the data the report creation needs, as shown below:

The
reporting tool calls the esProc script via JDBC, in a same manner as it calls
the stored procedure from a normal database. The syntax is this: call esProc script name (para1…paraN). The result
returned from the script participates in report creation in the form of a
normal data set. Details are covered in the following documents: esProc Integration & Application:
Integration with JasperReport and esProc Integration & Application:
Integration with BIRT.
As a professional tool for handling data
sources for reporting tools, esProc has more capabilities, which will be shown throughthe
following cases.
Interlocking multi-column layout
Arrange the records of the database table emp horizontally in two columns. The rule is that the record in each row’s second column will always be the first record in its next row’s first column. This is the expected report layout:
esProc script:

A2:An interlocking concatenation, which,in sequence, strings the current record and the previous one together. The concatenation result appears from the third row. Here is the result:

A3, B3, A4:
Arrange the data horizontally in two columns, as the preceding case shows.
Dynamic vertical multi-column layoutbased on single-field data sets
You need to display a single-field data set
in a report in a “the vertical first” order. Both the row number and the field
number are referenced by parameters. Below is the source data:
|
sOrder
26
33
84
133
32
39
43
71
99
20
83
97
107
135
142
1
|

A1: Retrieve
data from the single-field table and convert it to a sequence(an ordered set).

A3: This is the final result by appending data to A2:

Simple row-to-column transposition
The database table SALES holds order data. Below is a selection of
the source data:
|
OrderID
|
Client
|
SellerId
|
Amount
|
OrderDate
|
|
1
|
DSG
|
13
|
19480
|
2014-06-20 00:00
|
|
2
|
ERN
|
18
|
979
|
2014-06-13 00:00
|
|
3
|
JFE
|
19
|
28972
|
2014-12-11 00:00
|
|
4
|
OFS
|
21
|
4829
|
2014-02-24 00:00
|
|
5
|
ERN
|
22
|
21392
|
2014-02-01 00:00
|
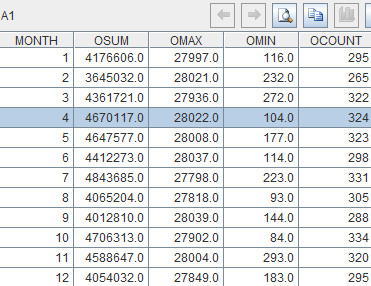
You need to calculate the total order amount, the biggest order
amount, the smallest order amount and the total number of orders in every month
of the year 2013, and then transpose the resulting data into a table with 13
fields and 4 rows. The four operations form the first field, subtotal. Each
month forms a field, with field names being 1, 2, 3, 4… The first five fields
are as follows:
|
subtotal
|
1
|
2
|
3
|
4
|
…
|
|
OSum
|
4176606
|
3645032
|
4361721
|
4670117
|
…
|
|
OMAX
|
27997
|
28021
|
27936
|
28022
|
…
|
|
OMIN
|
116
|
232
|
272
|
104
|
…
|
|
OCount
|
295
|
265
|
322
|
324
|
…
|
esProc script:

A1: Execute SQL statement to get data of 2013, and group and
summarize it by months. Here is the result:
A2: Create an empty table sequence with default values for storing the final data. There are 13 fields altogether and here are the first several fields:

A3:Loop through A1, retrieving one record each time and append it to A2 starting from the second field. Here is the final data:

A4:Return
A2 to the reporting tool.
Row-to-column transpositionwith dynamic member location
In the
database table tb, every three records with the same userid form a group. You
need to develop a report where the data groups are rearranged into rows of
data. Below is a selection of tb:
|
userid
|
type
|
descr
|
|
scooby
|
dog
|
dog
|
|
scooby
|
weight
|
50
|
|
scooby
|
hair
|
long
|
|
mickey
|
mouse
|
mouse
|
|
mickey
|
hair
|
|
|
mickey
|
weight
|
2
|
The
expected report layout:
|
userid
|
type
|
hair
|
weight
|
|
mickey
|
mouse
|
2
|
|
|
scooby
|
dog
|
long
|
50
|
esProc script:

A1:Database
query.

Multi-layer row-to-column transposition
In the
database kpi, every 4 records with the same f_site constitute a group. Below is
a selection of kpi:
|
dataset_date
|
f_site
|
ioh_kpi
|
idh_kpi
|
iol_kpi
|
|
2015/04/21 13:15
|
X6SF_SARF1
|
1
|
2
|
3
|
|
2015/04/21 13:30
|
X6SF_SARF1
|
9
|
1
|
2
|
|
2015/04/21 13:45
|
X6SF_SARF1
|
8
|
9
|
1
|
|
2015/04/21 14:00
|
X6SF_SARF1
|
7
|
8
|
9
|
|
2015/04/21 13:15
|
XC_01
|
2
|
3
|
4
|
|
2015/04/21 13:30
|
XC_01
|
11
|
12
|
13
|
|
2015/04/21 13:45
|
XC_01
|
21
|
22
|
23
|
|
2015/04/21 14:00
|
XC_01
|
31
|
32
|
33
|
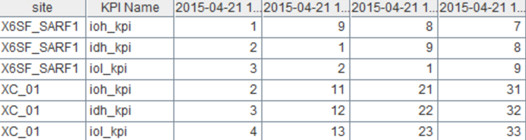
Group
data by f_site and perform row-to-column transposition based on each group so
that you can get a report like this:
|
site
|
KPI Name
|
2015/04/21 13:15
|
2015/04/21 13:30
|
2015/04/21 13:45
|
2015/04/21 14:00
|
|
X6SF_SARF1
|
ioh_kpi
|
1
|
9
|
8
|
7
|
|
idh_kpi
|
2
|
1
|
9
|
8
|
|
|
iol_kpi
|
3
|
2
|
1
|
9
|
|
|
XC_01
|
ioh_kpi
|
2
|
11
|
21
|
31
|
|
idh_kpi
|
3
|
12
|
22
|
32
|
|
|
iol_kpi
|
4
|
13
|
23
|
33
|
esProc script:

A2: Get
dataset_date values that are distinct from each other –which is ["2015-04-21
13:15","2015-04-21 13:30","2015-04-21
13:45","2015-04-21 14:00"].
B2:Get
A1’s field names from the third one – which is ["ioh_kpi","idh_kpi","iol_kpi"]
A3:
Create an empty table sequence for storing the final result set, whose field
names are site,KPI Name,"2015-04-21 13:15","2015-04-21
13:30","2015-04-21 13:45","2015-04-21 14:00".
A4:Group
A1 by f_site and run a loop through every group. B4 aligns A4 to A2, during
which a missingvalue will be filled with a default one. B5 appends records to
A3 dynamically.
Rows duplication
This scenario is to get three duplicates of
the original records and display them in a report.

A2:[] indicates a sequence (an order set). [~] represents a single-member sequence containing the current record from A1. [~]*3 makes 3 duplicates of the current record. conj function performs the duplication of every record of A1 and then the concatenation. This is the result:

Condition-controlled formats for grouped reports
In this case, a grouped report is required.
The data comes from the database table sOrder, in which Seller is the grouping
field, and Client and Amount hold the detail data. Here are the requirements:
1. In each group of detail data,
the rows from the second down to the end will display“+”, but the first row
will not display it.
2. If there is more than one row
in each group of detail data, display a subtotal of the amounts at the end. No
subtotal for a single-row group.

esProc script:

A1:A SQL query.
A2:Create an empty two-dimensional table to
store the final result set.
A3:Group A1 by Seller and loop through
every group. The working range of the loop statement is the indented cells
B3-C4, in which A3 is used to reference a loop variable.
B3: Append data values in the current group
to A2. Put “+” before the Client value if the sequence number “#” is greater
than 1.
B4-C5:
Append a subtotal row to A2 if the number of rows of the current group is greater
than 1. Below is the result that A2 will get eventually:

A5: Return A2 to the reporting tool using
JDBC.
No comments:
Post a Comment