
In
addition to conventional databases, data sources of a reporting tool could also
involve JSON files, MongoDB, txt files, Excel and HDFS files. Normally
reporting tools can handle a single data source, but they are unable to manage
various data sources requiringconsolidation. Even though the data sources are
of the same type, you still need to write a lot of code for the report developmentif
they come from a database without effective computability.
However,
esProc (free edition is available)can solve both problems. It offers a large
number of functions for manipulating (semi)structured data, and supports
heterogeneous data sources with the ability of integrating them. Besides, esProc
provides a simple and easy-to-use JDBC interface, through which a reporting
tool will call an esProc script as a database stored procedure, pass parameters
to it, execute it and get the result set.
Below is
the structure of integration of an esProc script and a reporting tool:

This is
an example of how esProcimplementsqueryinga multi-level subdocument in a JSON file
for creating a report:
jsonstr.json has a subdocument, runners
field, which has three fields - horseId,
ownerColours and trainer– in which trainer
contains a subfield -trainerId. The
report needs to present the horseId, ownerColours and trainerId field for each subdocument within runners filed according to its serial number.
The
source data:
[
{
"race": {
"raceId":
"1.33.1141109.2",
"startDate":
"2014-11-09T13:15:00.000Z",
"raceClassification": {
"classification":
"Novices'"
},
"raceType": {
"key":
"H"
},
"raceClass": 4,
"course": {
"courseId":
"1.33"
},
"meetingId":
"1.33.1141109"
},
"numberOfRunners": 2,
"runners": [
{
"horseId":
"1.00387464",
"trainer": {
"trainerId":
"1.00034060"
},
"ownerColours":
"Maroon, pink sleeves, dark blue cap."
},
{
"horseId":
"1.00373620",
"trainer": {
"trainerId":
"1.00010997"
},
"ownerColours":
"Black, emerald green cross of lorraine, striped sleeves."
}
]
},
……
]
|
esProc script:

A1:Read
in the JSON file.

A3:Get the desired fields to generate the result set the report needs. The result is as follows:

The
reporting tool calls the esProc script via JDBC, in a same manner as it calls
the stored procedure from a normal database. The syntax is this: call esProc script name (para1…paraN). The result
returned from the script participates in report creation in
the form of a normal data set. Details are covered in the following documents: esProc Integration & Application:
Integration with JasperReport and esProc Integration & Application:
Integration with BIRT.
As a professional tool for processing data
sources of reports, esProccan be used to implement more scenarios, as shown by
the following examples.
Create a grouped report from a multi-level JSON file
Cells.json is a multi-level nested JSON file, which you want to display with a
grouped report. The grouping fields are name,
type and image."xlink:href". There is also a field with 3
subdocuments: custom.Identifier, custom.Classifier and custom. Output, which are of the same
structure but contain different number of documents each.
The source data:
{
"cells": [
{
"name": "b",
"type":
"basic.Sensor",
"custom": {
"identifier": [
{
"name":
"Name1",
"URI":
"Value1"
},
{
"name":
"Name4",
"URI":
"Value4"
}
],
"classifier": [
{
"name":
"Name2",
"URI":
"Value2"
}
],
"output": [
{
"name":
"Name3",
"URI":
"Value3"
}
]
},
"image": {
"width": 50,
"height": 50,
"xlink:href":
"data:image/png;base64,iVBORw0KGgoAAAANSUhEUgAAAIAAAACACAYAAADDPmHLAAAAB
HNCSVQICAgIfAhkiAAAAAlwSFlzAABEJAAARCQBQGfEVAAAABl0RVh0U29mdHdhcmUAd3Vi8f+k/EREURQtsda2Or/+nFLqP6T5Ecdi0aJFL85msz2Qxy f4JIumMAx/ClmWt23GmL1kO54CXANAVH+WiN4Sx7EoNVkU3Z41BDHMeXAxjvOxNr7RJjzHX7S/jAflwBxkJr/RwiOpWZ883Nzd+Wpld7tkBr/SJr7ZHZb HZeuVweSnPfniocMAWYwcGBafH0OoPamFGAaY4ZBZjmmFGAaY4ZBZjmmFGAaY4ZBZjmmFGAaY7/B94QnX08zxKLAAAAAElFTkSuQmCC"
}
},
……
]
}
|
esProc merges the three subdocuments into a single two-dimensional table, gives them a new field name ctype to be identified and joins them with the grouping fields. By doing so, a typical “table with subtables” will be created. esProc code is as follows:

A1: Import the JSON file. The relationships between different fields are shown below:

A2: Convert the multi-level nested JSON file to a simple two-dimensional table. The sign “|”means concatenation. new function creates a two-dimensional table based on the source data. conj function calculates based on each record of the source table and concatenates the results. A2’s resulting two-dimensional table is what you need to create the report, as shown below:

Then it’s
easy for you to build a grouped report according to this esProc result.
Create a report with subreports using different JSON files
You want
to create a report containing multiple subreports, where the main report and
each subreport use different JSON files as their sources. Below is a selection
of the source data:
MainReport.json
|
{"menu":
[
{
"id":
"A1",
"value":
"File",
"popup":
"Yes"
},
{
"id":
"A2",
"value":
"Edit",
"popup":
"No"
}
]
}
|
SubReport1.json
|
{"menuitem":
[
{"value": "New",
"onclick": "CreateNewDoc()"},
{"value": "Open",
"onclick": "OpenDoc()"},
{"value": "Close",
"onclick": "CloseDoc()"}
]
}
|
SubReport2.json
|
{"menuitem":
[
{"value": "Undo",
"onclick": "onUndo()"},
{"value": "Redo",
"onclick": "onRedo()"},
{"value": "Copy",
"onclick": "onTextCopy()"},
{"value": "Past",
"onclick": "onTextPast()"}
]
}
|

Read in the JSON file and get its first field, which is represented by “.#1”. By assigning different file names to the parameter argFileName, the report will receive different data sets, as the following shows:

Perform a join between MongoDBand MySQL
emp1 is a MongoDB collection, whose CityID
field is the logical foreign key pointing to CItyID field of cities, a
MySQL table that has two fields –CityID
and CityName. You need to query
employee records from emp1 according
to specified time period and switch its CityID
field to CityName of cities.

A1:Connect to MongoDB.
A2:Query emp1using MongoDB syntax by the specified time period. find function returns a cursor. @x option means closing the MongoDB connection automatically after the data is all fetched. The result would be like this:

A3:Execute SQL statement to query the MySQL database. Here is the result:

A4: Replace A2’s CityID field with the corresponding records in A3. switch function works as a left join does. To perform an inner join, use @i option. By performing field replacement using switch function, the key field linkingthe two tables can be accessedthrough the object. This object-type access is simple and intuitive, whose merits are especially obvious when performing a multi-level, multi-table join. Here is the result of switch:

A5:Retrieve the desired fields to generate a table as follows:

A7:By
default the esProc script will return the last calculation cell (here is A5) to
the reporting tool.
Perform joins between MongoDB collections
Both sales
and emp are two-dimensional MongoDB
collections. sales has SellerId field as its logical foreign
key that points to emp’sEId field. You need to query orders in sales by the specified time period and
associate with emp through a left
join, and then present the result in a report.

A1,A4:Connect to/disconnect from MongoDB.

A3:Retrieve data from the emp collection. Here is the result:

A5:Join the two collections together. join function performs the join operation. @1 means left join and @f means full join. Without any of the options, thisfunction performs an inner join. The result is as follows:

A6:Retrieve the fields of interest from the result of join to generate a new two-dimensional table, as shown below:

Join an Oracle table and an Excel file
Here are table1, which is stored in an Oracle database, and table2, an .xlsx file. Both have the same structure. Below are selections from them: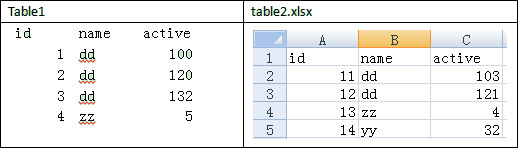
You need to group table1 and table2 respectively by name, count the number of members in each group, calculate the sum for each group by active field, and then present the resultsfrom the two tables in sequence. The expected report layout is as follows:

esProc script:

A1:Execute the SQL statement to group and aggregate data from table1. Here is the result:

A2:Import
the Excel file and make the first row the column headers.

A4:Perform a left join between A1 and A3. You’ll get the following result:

A5:Retrieve the fields you want from A4 and rename them. This is the result you’ll get:

Join a txt file and a JSON file
structure.txt is a
structured text separated by tabs. json.txt
contains unstructured JSON strings. There is a foreign key relationship between
the second field of structure.txt and
part of the text in json.txt. Below
are selections from them:
structure.txt
Name1 BBBBBBBBBBBB 99.40 166 1 0 1 166 334 499 3e-82 302
Name2 DDDDDDDDDDDD 98.80 167 2 0 1 167 346 512 4e-81 298
|
Json.txt
[
{ "Cluster A": {
"member": { "Cluster A": "BBBBBBBBBBBB This is
Animal A" }, "name": "Cluster A" } },
{ "Cluster B": {
"member": { "Cluster B": "DDDDDDDDDDDD This is
Animal B" }, "name": "cluster B" } }
]
|
You need
to create a report to present the above relationship. This is the expected
report layout:
Name1 BBBBBBBBBBBB 99.40
166 1 0 1
166 334 499 3e-82 302 Cluster
A This is Animal A
Name2 DDDDDDDDDDDD 98.80
167 2 0 1
167 346 512 4e-81 298 Cluster
B This is Animal B
|
esProc script:

A1-A3: Read in the JSON file, get the desired data and append a calculated column. Here’s the result:

A4:Import
the text file as a two-dimensional table. Note that esProc can import not only
a local file, but a file stored on LANs orin the HDFS file system.
A5:A join operation. The result is as follows:

A6: Retrieve the desired fields to generate a table as follows

No comments:
Post a Comment