
Sometimes
you need to reference data sources dynamically through a parameter, merge data
sources into one, or dynamically pass data source name to a subreport/Table
control.Often reporting tools - especially those with support for single data
source, such as BIRT and Jasper –have to use a high-level language to
accomplish these requirements, or trade security for reduced complexity.
However,
they can work with esProc (free edition is available) to offset their
disadvantages. esProc encapsulates a large number of functions for handling
structured data, supports parsing expression dynamically and handling
computations involving multiple data sources, and creates dynamic data sources
with simple scripts. In addition, it provides simple and easy-to-use JDBC
interface through which a reporting tool gets the result of executing esProc
script, which will be recognized as a database stored procedure and receive
parameters from the reporting tool.
Below is
structure of integration of an esProc script and a reporting tool:

Now,
through an example, let’s look at the basic process of esProc’s switching data
sources using the parameter:
myDB1
and oraDB are data sources that point to different databases. Each holds a
sOrder table with the same structure. The report requires connecting to data
sources dynamically via a parameter, querying sOrder for orders whose amounts
are greater than 1,000, and displaying them.

Here is a selection from the sOrder table in oraDB:

esProc
script:
=${pSource}.query("select * from sOrder
where Amount>?",pAmount)
Both
pSource and pAmount are report parameters. pSource represents the data source
name; ${…} indicates parsing a string or a string variable into an expression.
pAmount stands for the order amount.

When pSource=“oraDB”, A1 gets this result:

The
reporting tool calls the esProc script via JDBC, in a same manner as it calls
the stored procedure from a normal database. The syntax is this: call esProc script name (para1…paraN). The result
returned from the script participates in report creation in the form of a
normal data set. Details are covered in the following documents:esProc Integration & Application: Integration
with JasperReport and esProc
Integration & Application: Integration with BIRT.
As a professional tool for handling data
sources for reporting tools, esProchas more abilities, which you’ll see in the
following cases.
Perform a multi-data-source pre-join
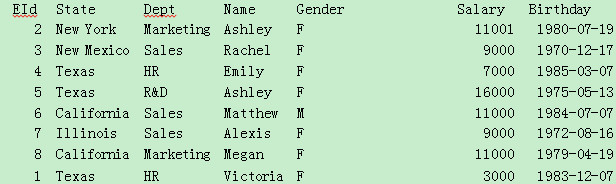
The mySQL database stores a Sales table
holding orders from different sellers per day. Its SellerID field contains seller
numbers. In MSSQL database there is an emp table of seller information in which
EID field contains seller numbers. Create a report to display order numbers,
order dates, order amounts, seller names and their departments, based on the
condition that the orders should be within the last N days (say 30 days) or
belong to certain important departments (say Marketing and Finance). Below are
selections of the original tables:

Database table emp
esProc script:

A1,A2:Database queries. myDB1 and myDB2
point to MySQL and MSSQL respectively.
A3: Replace A1’s SellerID field with the corresponding records in A2 according to the key field EID. The result is as follows (the data items in blue contain sub-members):

By default, when there is not a
corresponding record in A2 for a SellerID value, switch function retains the A1’s
record while the SellerID shows an empty value. The effect is like a left join.
Use @i option if you want to perform an inner join. The code is A1.switch@i(SellerId,A2:EId).
A4: Filter on the result of join. The first
filtering criterion is that orders are within the last N days (this corresponds
to parameter days),whose expression
isOrderDate>=after(date(now()),days*-1).
The second one is that orders belong to several important departments (this
corresponds to parameter depts),
whose expression is depts.array().pos(SellerId.Dept).
The operator || denotes the logical OR operation.
after function calculates the relative time
duration. array function splits a string into a set using delimiters. posfunction
locates a member in a set. SellerId.Dept means Dept field in the record corresponding
to SellerID field.

A5: Get the fields of interest from A4. Here is the final result:

Combine result sets with union
Result sets ds1 and ds2 have the same structure, but they come from different data sources – MySQL and a text file respectively. Now concatenate them and display the result in a cross table. Below is the original data: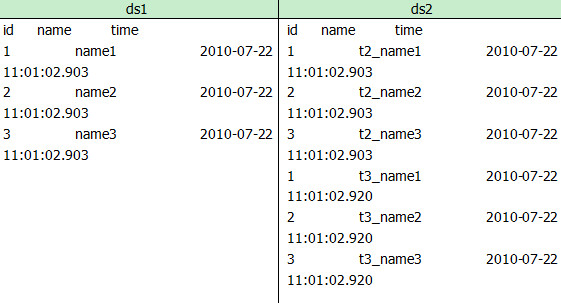
esProc script:

A3: Concatenate
the two data sets. The reporting tool’s work is just to create a simple cross
table based on the resulting one data set.
Handle different data sources for main report and subreport
For a reporting tool that can support only
one data source, if the reporting requires different data sources for the main
report and the subreport, it needs to pass in the database URL explicitly or
use Java classes to combine the different data sources into one. The former
approach is vulnerable to security problems and the latter one produces
complicated code. esProc, however, is able to cope easily. Here is an example.
Build a report with a subreport to display
order information of sellers whose salaries are within a certain range. The
main report’s data source is an emp table (in MySQL database) and the subreport’s
data comes from a sales table (MSSQL database).
esProc scripts:
empEsProc.dfx(for the main report)
A1: Query the emp table in MySQL database
by the salary range.

A1: Rrtrieve orders records from the sales table in MSSQL database according to employee IDs. Suppose eid=1, the result would be:

You can
see that the two data sources have been joined into one source with esProc. The
reporting tool just needs to call the corresponding esProc script for the main
report and the subreport.
Some
reporting systems do support multiple data sources. But it is hard to handle
reports with different and changeable data sources. In that case, using esProc
to generate a single data source can make the handling work easier.
For the
same reason, another reporting problem can be solved through esProc’s
single-data-source solution. That is the “multiple
subreports, multiple data sources” problem, which means there are many
subreports (or table controls) within one report and each has its own data
source.
Perform dynamic join between main report and its subreports
A main report
may use many subreports whose data sources come from multiple databases. The
reporting needs to display the result of dynamic join between these data
sources and the one the main report uses. esProc implements the task in a
simple way. For example:

esProc script:

A1:Execute the SQL statement to retrieve data from the org table in Master data source. arg1 is a parameter passed from the reporting tool. When arg1=”ORG”, the result would be:

A2:Loop through A1’s records to associate one
subtable each time,concatenatingeach result of join into B2. esProc uses the
natural indentation to represent the loop statement’s working range. Here the
loop body is B2-B7 where A2 is used to reference a loop variable and #A2 is
used to reference the loop number.
B2: Get the data source name for each
record according to its org_id field. The result during the first loop is “S_odaURL”.
B3: This is the explicit connectionto
corresponding data source.
B4: Filter on data in the User table.
B5: Append three columns, which derive from the main table, to B4’s subtable. The result during the first loop is:

B6:Concatenate B5’s result into B1. The operator “|” is equivalent to union function. When the loop is over, B1 will have collected all data the reporting needs, as shown below:

B7: Close data source connection
explicitly.
A8: Return B1 to the reporting tool
explicitly. The default execution is to return the result of the last cell.
Display data by different time units specified by parameter
Here is
a reporting task that requires using a line graph to show the change of sales
over a recent period. unitType is a report parameter, representing time units. If
unitType="hour", show sales amount every five minutes in the past one
hour. If unitType="day", show sales amount per hour during the past
day. And show sales amount per day over the past one week if unitType="week".
The data originates from the orders table in which Amount field contains order
amount. t is used to reference the order time.

A1:An
empty result set used to store the time sequences generated from B2-B4.
A2-B4:Generate
different time sequences according to the report parameter unitType. B2 generates
12 time points, with an interval of 5 minutes between each other. B3 generates
time points in one day, and B4 generates time points during one week.
A5:Loop
through A1 to calculate the sales amount of each time interval. “~” represents
the current member and “~[-1]" represents the previous one. In the case of
unitType="day", a one-field result set containing 12 records will be
generated.
A6:Return
A5 to the reporting tool via JDBC. Then you can plot the graph to show the
data.
No comments:
Post a Comment