Generally, Java programmers use poi or other open source packages to
read and compute Excel data. These open source packages support low-level
programming, which increases the overall learning cost and complicates the
operation. But with the help of esProc, Java can avoid these problems.
An example will make the point clearly
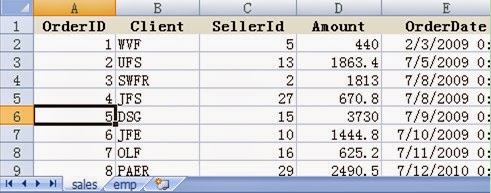
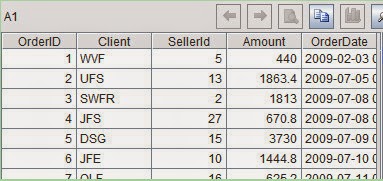
understood. Read the information of sales orders from the Excel file orders.xls and select sales orders that
placed on and after January 1st, 2010 and in which SELLERID is equal
to 18. The content of orders.xls is
shown as follows:
|
ORDERID
|
CLIENT
|
SELLERID
|
AMOUNT
|
ORDERDATE
|
|
1
|
UJRNP
|
17
|
392
|
2008/11/2 15:28
|
|
2
|
SJCH
|
6
|
4802
|
2008/11/9 15:28
|
|
3
|
UJRNP
|
16
|
13500
|
2008/11/5 15:28
|
|
4
|
PWQ
|
9
|
26100
|
2008/11/8 15:28
|
|
5
|
PWQ
|
11
|
4410
|
2008/11/12 15:28
|
|
6
|
HANAR
|
18
|
6174
|
2008/11/7 15:28
|
|
7
|
EGU
|
2
|
17800
|
2008/11/6 15:28
|
|
8
|
VILJX
|
7
|
2156
|
2008/11/9 15:28
|
|
9
|
JAYB
|
14
|
17400
|
2008/11/12 15:28
|
|
10
|
JAXE
|
19
|
19200
|
2008/11/12 15:28
|
|
11
|
SJCH
|
7
|
13700
|
2008/11/10 15:28
|
Implementation approach: Call esProc script
using Java program, read and compute the data in the Excel file, and then
return the result in the form of ResultSet
to Java program. Since esProc supports analyzing and evaluating expressions
dynamically, it will enable Java to process data as flexibly as SQL does.
First, programmers can take the criteria “sales
orders that placed on and after January 1st, 2010 and in which
SELLERID is equal to 18” as the parameter where
and pass it to esProc program. This is shown as follows:

where is a string, its value is ORDERDATE>=date(2010,1,1) &&
SELLERID==18.
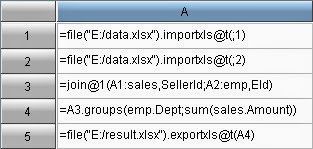
The code for esProc program is:

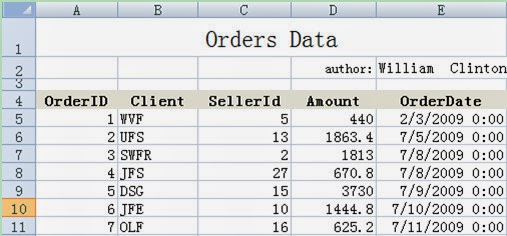
A1: Define a file object and import the Excel
data into it. esProc’s IDE can display the imported data visually, as shown in
the right part of the above figure. Importxls function can access xlsx files too and can automatically
identify the version of Excel according to the filename extension.
A2: Perform the filtering according to the
criteria, using macro to realize parsing the expression dynamically. The “where”
in this process is an input parameter. In executing, esProc will first compute
the expression surrounded by ${…}, take the computed result as macro string
value, replace ${…} with it and then interpret and execute the code. The final
code to be executed in this example is=A1.select(ORDERDATE>=date(2010,1,1)
&& SELLERID==18).
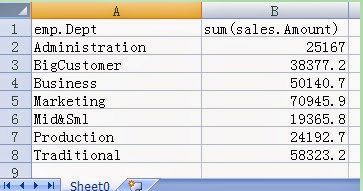
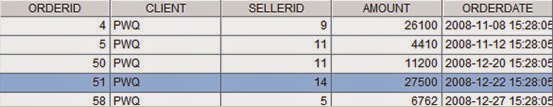
A3:Return the eligible result set to Java. If the result needs to be written to another Excel file, just modify the code in cell A3 to =file("D:/file/orders_result.xls").exportxls@t(A2). If the criteria are changed, you just need to modify “where”– the parameter. For example, it is required to select sales orders that placed on and after January 1st, 2010 and in which SELLERID is equal to 18, or Client is equal to PWQ. The value of “where” can be written as CLIENT=="PWQ"||ORDERDATE>=date(2010,1,1) && SELLERID==18. After the code is executed, the result set in A2 is as follows:
Call this piece of code in Java with esProc
JDBC and get the result. Detailed code is as follows (save the above program in
esProc as test.dfx):
// create a connection using esProc
jdbc
Class.forName("com.esproc.jdbc.InternalDriver");
con= DriverManager.getConnection("jdbc:esproc:local://");
// call the program in esProc (the stored
procedure); test is the name of file dfx
com.esproc.jdbc.InternalCStatementst =(com.esproc.jdbc.InternalCStatement)con.prepareCall("call
test(?)");
// set
parameters
st.setObject(1,"ORDERDATE>=date(2010,1,1)
&& SELLERID==18 || CLIENT==\"PWQ\""); // execute the
esProc stored procedure
ResultSet set =st.executeQuery();
If the script is simple, the code can be
written directly into the program in Java that calls the esProc JDBC. It won’t
be necessary to write a special script file (test.dfx):
esultSet set = st.executeQuery(
"=file(\"D:/file/orders.xls\").importxls@t().select(ORDERDATE>=date(2010,1,1)
&& SELLERID==18 || CLIENT==\"PWQ\")");
This piece of code in Java calls a line of
code in esProc script directly, that is, get the data from the Excel file and
filter it according to the criteria.