Showing posts with label OLAP software. Show all posts

December 18, 2012

Why OLAP Always Mean Cube Modeling, Secrets of OLAP You Never Know

The original post URL: http://it.toolbox.com/blogs/data-analytics/the-secret-of-olap-you-never-knew-53917

When talking about OLAP, people always means cube modeling. Most of us will wondering, if we don't have modeling, how can we go on data analytics? Why OLAP always means Cube-modeling? Can't we just go on business computing without cube-modeling? Maybe there are some secrets you don't know about OLAP.

The typical usage of traditional OLAP tool is always to build module first and then analyze data as if it was a convention. Is the modeling unavoidable? Why we build model? Why we spend time and efforts in this stage instead of analyzing the data directly? Why the performance is still an excuse to put off the innovation despite the hundred-fold increases in hardware performance throughout all these 20 years? What is the root cause?

For the countless questions, the answer is only one. It discloses the secret of OLAP you never knew: The traditional OLAP suffers from insufficient computational capability, and even the limited computational capabilities available are gained at the cost of modeling. Modeling is the means to make up for the product drawback by forcing customers to pay for it.

This discussion here will expose this secret by pointing out 3 facts: First, modeling is not necessary at all. Second, modeling brings about disaster. Third, the real look of OLAP.

The discussion here will start with an example. A retailing business needs to analyze the results of new sales policy implemented in the latest 3 months, and develop the corresponding actions.

Firstly, it is impossible to design an all-roundly complete analystics model beforehand. For example, the new policy may mainly affect the sales achievement, team relation,or even the sales force management. The sales achievement may probably go through a host of possibilities of sudden rise and drop. The sudden rise of sales achievement may result from either the large orders placed with short lead time, or the increase in the volume of orders. There are many branches and fluctuations. Every time, users have to judge momentarily on the unpredictable tendency of branches, which means it is impossible for them to design a clear route to analyze.

Secondly, the model restricts the freedom of analyzers. Modeling means analyzers can only take actions in a stipulated scope. For example, the analysis cannot be completed if you want to import the data of fellow retailers for comparison during analyzing, because the temporary data import is not allowed for models...For another example, without the slicing, rotating, drilling, and other traditional OLAP functions, it is impossible to compute the big clients accounting for 60% of the total profits. The original intention of OLAP is the arbitrary interactive computation. The typical procedure is to firstly make an assumption on the obscure goal, secondly, verify or falsify these assumptions, then correct the assumption continually, and ultimately reach the right decision. The traditional OLAP does not support the arbitrary interactive computation on data, and its limited function hinders the freedom of analyzers, and therefore cannot make the truly valuable decision.

At last, modeling cannot hold the changing requirements. The commercial opportunities are evanescent. Facing the ever changing demands, OLAP must provide the right analysis decision in the shortest time. For example, the continual decreasing of order volumes draws the attention from executives. It is pressing to determine whether there is a relation between the order decreasing and the new policy. When the traditional OLAP encounters such new requirements, users can only request the technical experts and business specialists to design the new models, and then keep on adapting the models to the practical business, sometimes the model has to be reworked when it turns out to be incapable in the analysis stage. During this period, a great deal of time, money, human resources, and physical resource would be spent. When all analyses have been done, the business opportunities have slipped away.

Therefore, the model is not a necessity. On the contrary, modeling makes OLAP lost customers and market. According to findings from Google, since 2004, attentions on OLAP drop by 85 percent. In fact, most users just take OLAP as an expensive presentation tools.

The market is thirsty for OLAP product with improved computational capabilities, that is, a brand new product not requiring modeling, capable to carry out direct analysis on the history data, and provide the timely decision on the arbitrary interactive computation. It must be featured by:

Support the friendly interaction. It will lower the requirements on technical background to ensure that even the normal business personnel can grasp it easily. The analysis result in any step must be always clear and visible. According to the intermediate result, users can manipulate the data straightforwardly and intuitively on menu. OLAP is intended to serve the purpose of business decision for the business specialist users. For the business specialists with limited IT experience, user-friendly interaction is just what they need.

Free multi-step computation. The OLAP tools must be able to arbitrarily decompose the complex problem into several simple steps. Seek the solution to a complex problem by solving lots of simple problems. The step-by-step computation is the key to solve the complex problems. Traditional OLAP tools are confined by the model and unable to solve the complex problem, not to mention the arbitrary operations. For example, the problem of "Compare the product sales fluctuations in the half year" can be decomposed into these simple steps: Filter out the order data in the half year; Group the data by month; Summarize the sales in each year; Perform the year-over-year monthly comparison.

Support the structural data. In the business system, a huge amount of structural data is scattered here and there, for example, in database, or Excel and text file. The ideal OLAP should be capable to provide the direct support for the massive computation on the structural data, such as grouping, summarizing, associating, and filtering. Although SQL can support the structural data well, SQL also requires a relatively higher technical background on users. To implement a bit more complex computation, users will have to write a great deal of scripts hard to write and maintain. The ideal product is the one that is comparable to SQL in computational capabilities with relatively lower requirements on technical background, so that the business specialists can use it easily.

Optimize the business computing. Unlike the scientific computing, the business computing often requires the thinking from business perspective. For example "which products among the top 10 best-sellers last year still remain the top 10 best-sellers this year". In business computing, users shall seek the interactive set of the 2 objects intuitively, instead of writing a large section of SQL/VB/JAVA scripts, and the way to represent the intersection set between objects easily using the business terms. The similar examples also include the associative relations to represent the multi-level relation, for example, the problem "for the sales managers responsible for the products among the top 10 best-sellers, how much contribution their clients made to it". In addition, the complex problem of commercial computing is always related to orders: ranking, link relative ratio, year-over-year comparison, etc., for example, "products whose sales volume keep rising in consecutive three months". All these problems need representing in a concise and easy-to-understand way.

The esProc/esCalc family products from esProc are just the desired software, of which, esProc is good at multi-step computation and solving the complex problems; esCalc relies heavily on the friendly interaction and ideal for the business personnel. They have the advantages below:


Modeling free - esProc/esCalc does not require modeling because its professional computational capability enables its users to analyze on business data immediately to provide the decision support promptly, and seize the evanescent business opportunities ultimately.

Arbitrary computation - esProc/esCalc provides the arbitrary computational capability to implement the truly arbitrary OLAP computation. The enterprise can thus be provided with the valuable data for decision-making. It boasts the friendly interaction, arbitrary multi-step computation mechanism, and optimization on business computation, such as the complete set computation, ordered computation, and object references.

Relatively low technical standard - esCalc/esProc has lowered the technical requirements on the analyzer and designed especially for the business specialists. Business specialist can complete the whole set of OLAP work independently, such as installing and deploying, determining analysis goal, decomposing task, retrieving data, verifying the conclusion, presenting the conclusions, and print & export.

The computational capability of esCalc/esProc is worth looking forward to in the hope that traditional OLAP tools could be inspired to confront their drawbacks. Let them commit to build the OLAP standard of the next generation collaboratively.


Related Articles from Raqsoft:

Business Intelligence Suppliers: Are You Ready for 2013?


Script Computation of esProc Optimizes Analysts' Benefits

Various Data Environments Support of esProc Makes Statistical Computing more Flexible


December 12, 2012

What's OLAP's Shortest Board and What's the Remedy

10 years ago, OLAP ushered the brilliant age of business intelligence. In the global market, it keeps growing at double digits. Enterprisers hope this new technology will help them implement the flexible and free data analysis, providing the truly valuable business decision, and telling them which are their cash cows and stars types businesses. With 10 years passed by, up to now, the splendid prospect of OLAP has long gone, enterprisers are completely disappointed with OLAP: It is a greedy monster that swallowing a great deal of money and time. More often than not, its ROI is worse than that of average reporting tools.

Google Trends highlights the awkwardness of OLAP straightforwardly:


How could this happen to OLAP? Did the father of relational database E.F.Codd make a serious mistake in introducing the OLAP? Off course no. However, the traditional OLAP tools should be blamed for it. These traditional OLAP tools have a deadly shortest board in computing. The time and money it costs the customers just flow away from this shortest board, only leaving the complaint and anger as an inevitable result.

Here is a practical example: To help a telecommunication company analyze its profit, the traditional OLAP tools are usually like this:

1. Have a double expert in both OLAP product technology and telecommunications business (usually an employee from the developer) to propose a common model in the industry. Then, have a double expert in both database technology and telecommunications business (usually an employee from the enterprise) to modify and customize this model according to the requirements and the data characteristics of itself. This stage can be called as "modeling". Generally, users have to consider various factors from a strategic perspective. Because the post-modeling modification would involve huge workload, the time would be relatively lengthy.

2. Have the data retrieved from database and populated into model by double skilled expert in both SQL and OLAP products. This stage can be generally referred to as "query". Because it requires developing a great number of scripts, the procedure is rather lengthy.

3. Business personnel will perform the data analytics based on the model to reach a certain conclusion. Broadly speaking, this procedure is called "computing" for which there is only a limited number of computing methods available, such as rotation, slice, and drilling. In fact, due to the elusive changing business opportunity and market tendency, the original model is hard to meet the demands and the remodeling is usually unavoidable. This stage would be also very time-consuming.

4. The "presentation" stage refers to presenting the result through the user-friendly and easy-to-understand style. This stage typically comprises a wide variety of tables and charts rich in styles and forms.

As we know, the traditional OLAP procedure comprises 4 stages: Modeling - Querying - Computation - Presentation.

Modeling is an unnecessary stage. Modeling is like a rather closed cell in which the jailed people are confined to take restricted actions. Try to analyze the data outside the analytical model? Impossible! Try to analyze the data through methods other than rotating, slicing, drilling, or other means? Still impossible!

In the OLAP procedure, the next step computing depends on the intermediate results. Analysts can neither predicate nor design a complete analytical model in advance. They can only take some assumptions according to the analysis goal, then verify and correct these assumptions continuously till achieving the desired results. For example:


  • Analyze the features of box office for a newly released movie.

  • Find out the reason why the customer complaints are rising.


  • Modeling cannot solve the above problems because modeling conflicts with the original intention of OLAP. It is high costly, often requires a long cycle, restricts the freedom, and unable to rapidly react to the fast changing business opportunities. The only advantage of modeling is the fast computational speed. However, with the several hundred-fold increases in these 20 years, computational speed is far less important than it used to be.

    Query is a stage in which there is still room to improve. The traditional OLAP is not only a bit too time-consuming, but also demands too much on users' technical background. In view of this, the query stage should be optimized so that even non-technical staffs can grasp it easily and implement rapidly. This article will not talk about query in detail since query is another topic to be discussed separately.

    Computation stage suffers from a serious shortest board. For most enterprises, lots of the commonest computation goals are impossible for the traditional OLAP tools to implement, such as:


  • Which are the top n clients accounting for the half sales?


  • Which stocks keep rising for 3 consecutive days?


  • The traditional OLAP does not support the arbitrary and interactive data computation, while this is the essence of OLAP. For example, decompose a complicated great goal to several simple steps. This is called as "Step-by-step Computation"; Intuitive interacting refers to viewing every intermediate result in an intuitive and understandable way to determine the computation of the next step; Perform any processing on the business data, including the filtering, grouping, associated querying, making statistics. The said business data is usually the massive structural data; Perform the set operation on the data from the business prospective. For example, to compute clients which is based in foreign countries and has a sales over one million; This is called as "Explicit Set"; Order Computation refers to ranking the business objects, link relative ratio, year-over-year compassion, and order-related computation; Access the associated data at multiple levels, for example, solve a problem through the "object reference" method: Of those line managers winning the President's Award, whose subordinates won the Outstanding Award of the year?

    It is not the original intention of the traditional OLAP to ignore the arbitrary interactive computation. It is all because the traditional solutions are full of unsolvable contradictions. For example, although JAVA, VB, and other senior languages are powerful enough to perform the step-by-step computation, they lack the computational abilities of structured data. SQL is powerful enough to perform the structured data computation. However, the computation level of SQL is relatively too low, while the technical requirements of SQL are relatively high. A bit more complex computation would require a great amount of obscure scripts. Since OLAP is the tool for business expert, few qualified talents who both excel in both business and SQL could be found. The competent person would be very costly to hire. Though Excel has the outstanding "intuitive interaction" ability, its computation is set for the independent cell data instead of the structural data. Plus, not having such features as "explicit set", "order computation", and "object reference", Excel cannot undertake the complex and in-depth analytics task.

    In fact, "modeling" is the pitfall introduced by the traditional OLAP tools to cover up their weakness in computing. Modeling adds limited computational capability to OLAP tools at the cost of a huge amount of time and money. It is evident that the limited computational capability is rather weak to support and produce the truly valuable analysis conclusion. Ultimately and regretfully, we see the undesirable result of Lose-Lose: OLAP lost the market and users waste their money and time.

    The only meritorious stage is the presentation The traditional OLAP tools have done so well in the presentation that they are virtually comparable to the professional reporting tools. This is the only meritorious stage for the traditional OLAP tools. OLAP is by no means to simply act as any kind of reporting tools. The excellent presentation performance cannot remedy their lame computational capability. After all, computation is the top priority of OLAP. No wonder many users comment that OLAP is "the reports flexible to some extent but quite costly". May I ask which customer can hold back his anger about the so-called OLAP?

    From the above analysis, we may find that the traditional OLAP should remove the modeling, optimize the query, rebuild the computing, and keep the presentation stage. The desired result would be Query - Compute - Present. Of which, rebuilding is the core to implement the arbitrary and interactive data computation. Obviously, the last resort of OLAP is to find a tool that is capable to remedy the shortest board of OLAP.

    The last resort is esProc, as a BI tool not requiring any modeling, it is capable to conduct the arbitrary computation and implement the true essence of OLAP. Let's find more about esProc:

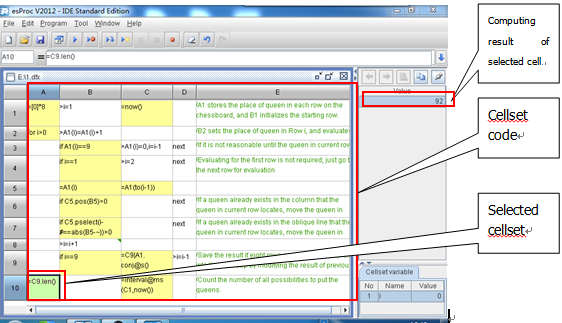
    Gird-style intuitive interacting: esProc supports the Excel style interface with an extra visibility into the intermediate result of each step, capable to carry on the computation by making a reference to the intermediate result with the cell name, as shown in the below sample figure:


    Perfect support for step-by-step computation: esProc can decompose the complex problem to simple computation procedure according to the business description. For example, analyzing the box office characteristics of new released movie, this complex and obscure problem can be decomposed to several such simple and clear problems as "total box office in last week".

    Tailored support for massive structural data: esProc is designed especially to process the structural data that is a common type of the business data. It is capable to filter, group, associated query, make statistics, and conduct other computations freely through the agile and easy-to-understand expressions.

    Support for explicit set: esProc is fully set-lized to represent the set, member, related generic object, and object reference conveniently. For example, to compute the clients whose sales are always among the top 10 in every year.

    Support for ordered computation: In the practical data analysis, a great number of complex computations are related to the data order, such as "to compute the month-over-month growth in percent". With esProc, the alike complex problems can be solved easily.

    Support for object reference: For the complex association at multiple levels, users can write the expressions following their business logics intuitively. With the period "." to make a reference to the object, the complex and lengthy multi-table Join statements can be converted into the simple object access. For example, to compute problems like: Of those line managers winning the President's Award, whose subordinates won the Outstanding award of the year?

    esProc requires no modeling in terms of OLAP analysis. With the professional computational capability, esProc enables users to rapidly respond to the ever changing business opportunities, submit the reference data for decision making, and save the operation cost in time and money.

    esProc provides the arbitrary computational capability to implement the truly arbitrary OLAP computation. The enterprise can thus be provided with the valuable data for decision-making.

    esProc does not require users having any experience in software development, offload the work from the senior technical assistance teams or double experts, reduce the technical requirements on the analysts, and further cut the human resources cost for enterprises.

    esProc remedies the shortest board of OLAP completely. It is a blockbuster to the deathly still OLAP market.

    Related News From Raqsoft:

    Christmas Big Discounts with Cash Back on IT Products
    Business Intelligence Suppliers: Are You Ready for 2013?
    Made-in-China IT Products Emerge with Outstanding Capability

    December 10, 2012

    OLAP Cask Principle Reveals the Future for OLAP Tools Manufacturer

    This post is originally posted on http://it.toolbox.com/blogs/data-analytics/olap-cask-principle-reveals-the-future-for-olap-tools-manufacturer-54044.

    Cask principle illustrates this idea: no matter how high the cask is, it is the shortest board of the cask, not the longest one, determines how much water the cask can hold. Same principle also applies to OLAP. The traditional OLAP comprises 4 pieces of slabs: modeling, query, computation, and presentation, the longest one is the presentation and the shortest is the computing. Unfortunately, computing is just the core to OLAP.

    Suppose an insurance company needs analyzing its operating status, and the traditional OLAP tools set the 4 boards as follows:

    Modeling: Have the double expert in OLAP product technology and insurances industry (usually the employee from the developer) to propose a common model in the industry. Then, have the double expert in database technology and insurances business (usually the employee from the enterprise) to modify and customize this model according to the requirements and the data characteristics of itself. This stage can be called as "modeling". Generally, analyzers have to consider various factors from a strategic perspective. Because the post-modeling modification would be huge, the time would be relatively lengthy.

    Modeling is like a rather closed cell in which people is confined to take restricted actions. Try to analyze the data outside the analytical model? Impossible! Try to analyze the data through methods other than rotating, slicing, drilling, and other methods? Still impossible!

    In the OLAP procedure, the next computation depends on the intermediate results. Analyst can neither predicate nor design a complete analytical model in advance. They can only take some assumptions according to the analysis goal, then verify and correct these assumptions continuously till achieving the desired results. For example: Analyze the differences of operation characteristics of various retail stores between the course of the Olympic Games and the normal days. Find out the reason for the recently released products suffering poor sales.

    Modeling cannot solve the above problems because modeling conflict with the essence of OLAP. It is highly costly, requires a long cycle, restricts the freedom, and unable to react to the fast changing business opportunities. The only advantage of modeling is the fast computational speed. However, with the several hundred-fold increases in these 20 years, computational speed is far less important than it used to be.

    Query: Have the data retrieved from the database and populated into model by skilled double expert in SQL techniques and OLAP products. This stage can be generally referred to as "query". Because it requires developing a great number of scripts, the procedure is rather lengthy.

    The traditional OLAP is not only a bit too time-consuming, but also requires too much on users' technical background. The querying stage should be optimized for average person to grasp it easily and implement rapidly. This paper will not detail the query since query is another topic to be discussed separately.

    Computation: Business personnel will perform the data analysis based on the model to reach a certain conclusion. This procedure can be referred to as "computing" broadly. In addition, preparation of data source, ETL procedure, and data analysis all belong to the scope of computation. As we know, the computational methods of OLAP are rotating, slicing, drilling, and other limited ones. In fact, due to the elusive changing commercial opportunity and market tendency, the original model is hard to meet the demands and the remodeling is usually unavoidable. This stage would be also very time-consuming.

    For most enterprise, lots of the commonest computation goals are very difficult for the traditional OLAP tools to implement, for example: Of the 2 types of mobile phones with the highest sales volume, which 3 brands have the greatest sales amount?

    Which products have the consecutive rising customer satisfaction in the recent 6 months?

    The traditional OLAP does not support the arbitrary and interactive data computation, while this is the essence of OLAP. For example, decompose the complicated great goal to many a simple milestone. This is called as "Step-by-step Computation"; Intuitive Interacting refers to viewing every intermediate result in an intuitive and understandable way to determine the computation of the next step; Perform any processing on the business data, including the filtering, grouping, associated querying, making statistics. The said business data is usually the massive structural data; Perform the set operation on the data from the business prospective. For example, to compute clients which is based in foreign countries and has a sales over one million; This is called as "Explicit Set";Order Computation refers to ranking the business objects, link relative ratio, year-over-year compassion, and order-related computation; Access the associated data at multiple levels , for example, solve a problem through the "object reference" method: Of those line managers winning the President's Award, whose subordinates won the Outstanding award of the year?

    It is not the original intention of the traditional OLAP to ignore the arbitrary interactive computation. It is all because the traditional solutions are full of unsolvable contradictions. For example, although JAVA, VB, and other senior languages are powerful enough to perform the step-by-step computation, they lack the computational abilities of structured data.SQL is powerful enough to perform the structured data computation. However, the computation level of SQL is relatively too low, while the technical requirements of SQL are relatively high. A bit more complex computation would require a great amount of obscure scripts. Since OLAP is the tool for business expert, few qualified talents who both excel in both business and SQL could be found. The competent person would be very costly to hire. Though Excel has the outstanding "intuitive interaction" ability, its computation is set for the independent cell data instead of the structural data. Plus, not having such features as "explicit set", "order computation", and "object reference", Excel cannot undertake the complex and in-depth analysis task.

    Presentation: The "presentation" stage refers to representing the result through the user-friendly and easy-to-understand style. Usually, this stage comprises a variety of tables and charts rich in styles and forms.

    The traditional OLAP does so well in the presentation that it virtually reaches the effect of professional report. This is the only meritorious stage. However, OLAP is not the reporting tool. The excellent presentation performance cannot remedy the lame computation ability. Moreover, computation is the top priority of OLAP. No wonder many users comment that OLAP is "the reports flexible to some extent but quite costly". May I ask which customer can hold back his anger about the wronged OLAP?

    As we can see, the cask of OLAP has already been leaked seriously. Google Trends highlights the awkwardness of OLAP straightforwardly:


    10 years ago, OLAP ushered the brilliant age of business intelligence. In the global market, it keeps growing at double digits. Enterprisers hope this new technology will help them implement the flexible and free data analysis, provide the truly valuable business decision, and tell them which are their businesses of cash cows and stars types? With 10 years passing by, to date, the splendid prospect of OLAP has long gone, enterprisers are completely disappointed with OLAP: It is a greedy monster that swallowing a great deal of money and time, leaving the ROI usually worse than the average reporting tools.

    How the traditional OLAP tools to cover up the poor computational capabilities? That's right. It is the modeling. Modeling gains the limited computational capabilities for OLAP tools at the cost of huge amount of money and time of users. Of course, the limited computational ability is not enough to generate the truly valuable analysis conclusion. Ultimately, we see such lose-lose result: OLAP lost the market, and users waste the money and time.

    How to get recognized by the industries and welcomed in market again? How to save the money and time for customers? This last resort is esProc, as a BI tool not requiring any modeling, capable to conduct the arbitrary computation, and implement the true essence of OLAP. It removes the modeling stage, optimize the querying stage, rebuild the computing stage, and maintain the presentation stage. This is all about it should be: Query - Compute - Present. It featured: gird-style intuitive interacting, perfect support for step-by-step computation, tailored support for massive structural data, support for explicit set, support for ordered computation, support for object reference. 

    Related Raqsoft Articles:

    Business Intelligence Suppliers: Are You Ready for 2013?
    Made-in-China IT Products Emerge with Outstanding Capability
    Various Data Environments Support of esProc Makes Statistical Computing more Flexible


    December 6, 2012

    OLAP is Only Expensive Presentation Tool, Get Rid of This Mistaken Thought

    OLAP is a type of BI software that emerged and gradually developed 20 years ago. OLAP can be used to handle the complex computation flexibly and rapidly according to the requirements of analyzers and present the result to the decision-makers in an intuitive and understandable style. The decision-makers can thus grasp the enterprise operating status accurately, understand the object requirements, and set the right scheme.

    The original intention of OLAP is the arbitrary interactive computation on data. To serve the purpose, OLAP tools should get rid of modeling, support the direct analysis on the history data, and provide the decision information through the arbitrary interactive computing timely. The traditional OLAP is stuck in the mistaken ideas of centralizing on modeling and focusing on presentation. According to findings from Google, since 2004, attentions on OLAP drop by 85 percent. In fact, most users just take OLAP tools as expensive presentation tools.


    The true OLAP should be featured by:

    Free multi-step computation. The OLAP tools must be able to arbitrarily decompose the complex problem into several simple steps. Seek the solution to the complex problem by solving lots of simple problems. The step-by-step computation is the key to solve the complex problems. For example:"Compare the insurance products sales fluctuations in the half year" can be decomposed into these simple steps: Filter out the data of insurance products sold in the half year; Group the data by month; Summarize the sales in each year; Perform the year-over-year monthly comparison. Traditional OLAP is confined by the model and unable to solve the complex problem, not to mention the arbitrary operations.

    Support the friendly interaction. It will lower the requirements on technical background to ensure that even the normal business personnel can grasp it easily. The analysis result in any step must be always clear and visible. According to the intermediate result, users can manipulate the data straightforwardly and intuitively on menu. OLAP is intended to serve the purpose of business decision for the business specialist users. For the business experts with limited IT experience, user-friendly interaction is just what they need.

    Support the structural data. In the business system, a huge amount of structural data is scattered here and there, for example, in database, or Excel and text file. The ideal OLAP should provide the direct support for the massive computation on the structural data, such as grouping, summarizing, associating, and filtering. Although SQL can support the structural data well, SQL also requires a relatively higher technical background on users. To implement a bit more complex computation, users will have to write a great deal of scripts hard to write and maintain. The ideal product is the one that is comparable to SQL in computational capabilities with relatively lower requirements on technical background, so that the business specialists can use it easily.

    Optimize the business computing. Unlike the scientific computing, the business computing often requires the thinking from business perspective. For example "which mobile phones among the top 20 best-sellers last year still remain the top 20 best-sellers this year". In the business computing, users shall seek the interactive set of the 2 objects intuitively, instead of writing a large section of SQL/VB/JAVA scripts. How to represent the intersection set between objects easily using the business terms. The similar examples also include the associative relations to represent the multi-levels, for example, "for the sales managers responsible for the insurance products among the top 3 sales, how much contribution their clients made to it". In addition, the complex problem of commercial computing is always related to orders: ranking, link relative ratio, year-over-year comparison, etc., for example, "stocks whose sales volume keep rising in consecutive 10 days". All these problems need representing in a concise and easy-to-understand way.

    The typical usage of traditional OLAP tool is always to build module first and then analyze data as if it was a convention. In facts, traditional OLAP suffers from the seriously insufficient computational capability. Therefore, it can only obtain the limited computational capability at the cost of modeling. Modeling is the means to make up for the product drawback by forcing customers to pay for it. Modeling is not a must. It is better to spend more time and efforts on data analysis than to just model. 20 years ago, the computer performance is low, and modeling can alleviate the pressure on computation. However, the present hardware performance has risen for hundreds times, and the role of modeling becomes less and less important.

    Let's use an example to illustrate the drawbacks of modeling. For example, an insurance company has implemented a new insurance policy in the recent 3 months. To analyze the effect of new policy, corresponding actions must be brought up.

    Firstly, it is impossible to design a complete analysis model beforehand. For example, the new policy may mainly affect the sales achievement, team relation,or even the sales force management. The sales achievement may probably go through a host of possibilities of sudden rise and drop. The sudden rise of sales achievement may result from either the large insurance product orders placed with short lead time, or the increase in the volume of insurance product orders. There are many branches and fluctuations. Every time, users have to judge momentarily on the unpredictable tendency of branches, which means it is impossible for them to design a clear path to analyze.

    Secondly, the model restricts the freedom of analyzers. Modeling means analyzers can only take actions in the stipulated scope. For example, without such data in the model, it is impossible to import the data about fellow insurance companies. For example, without the slicing, rotating, drilling, and other traditional OLAP functions, it is impossible to compute the occupations of VIP clients accounting for 60% of the total profits. The original intention of OLAP is the arbitrary interactive computation. The typical procedure is to firstly make an assumption on the obscure goal, secondly verify or falsify the assumption, correct the assumption continually, and then ultimately reach the right decision. The traditional OLAP does not support the arbitrary interactive computation on data; its limited function hinders the freedom of analyzers, and therefore cannot make the truly valuable decision.

    At last, models cannot hold the changing requirement. The business opportunities are evanescent. Facing the ever changing demands, OLAP must provide the right analysis decision in the shortest time. For example, the continual decreasing of insurance product orders volumes draws the attention from executives. It is pressing to determine whether there is a relation between the insurance product order decreasing and new policy. When the traditional OLAP encounters such new requirements, users can only request the technical experts and business specialists to design the new models, and then keep on adapting the models to the practical business, and reworking on the modeling when it turns out to be incapable in the analysis stage. During this period, a great deal of time, money, human resources, and physical resource is spent. When all analyses have been done, the business opportunities have slipped away.

    As can be seen from above, the model is not a necessity; on the contrary, modeling makes OLAP lost customers and market. That's why it is definitely necessary to get rid of the mistaken ideas of OLAP.

    The esProc/esCalc family product of Raqsoft is just such OLAP software that requires no modeling, capable to compute arbitrarily and friendly in interaction. Of which, esProc is good at multi-step computation and solving the complex problems; esCalc relies heavily on the friendly interaction and ideal for the business personnel. They have the below advantages:

    No modeling - esProc/esCalc does not require modeling because its professional computational capability enables its users to implement the immediate analysis on business data to provide the decision support promptly, and ultimately seize the evanescent business opportunities.

    Arbitrary computation - esProc/esCalc can be used to perform the arbitrary OLAP computation, enabling analyzers to process the data arbitrarily at their own will and provide the enterprise with the truly valuable data for decision making. It boasts the friendly interaction, arbitrary multi-step computation mechanism, and optimization on business computation, such as the complete set computation, ordered computation, and object reference.

    Technical standard is relatively low
    . esCalc/esProc has lowered the technical requirements on the analyzer and designed especially for the business specialists. Business specialist can complete the whole set of OLAP work independently, such as installation and deploy, determining analysis goal, decomposing task, data retrieval, verifying the conclusion, presenting the conclusion, and print & export.

    The computational capability of esCalc/esProc is worth looking forward to in the hope that it will help traditional OLAP to get rid of the mistaken ideas, and work together to develop the next generation of OLAP specifications, and get recognized by the industries and be popular in the market again.

    Related Raqsoft Articles:

    Business Intelligence Suppliers: Are You Ready for 2013?
    Made-in-China IT Products Emerge with Outstanding Capability
    Various Data Environments Support of esProc Makes Statistical Computing more Flexible

    August 13, 2012

    Free Record Acess: Serial Number, Locating and Sorting In esProc


    In esProc, the data is ordered. You can access the data freely by locating, ranking, sorting, and with other methods.


    "Being ordered" means the data are stored in a specific order. Every piece of data of each record has its own relative or absolute serial number. You can access the data according to its serial number and feel free to perform the order-relating actions on data, such as locating, ranking, and sorting.
    The typical algorithms involving "being ordered" include the top N records, year-on-year, and link relative ratio statistics. The ordered data with esProc can help you solve a great number of challenges easily regarding the data analysis.
    Check the below examples for further explanation.

    I Case and Comparison

    Case

    Assume that there is a telecommunications product manufacturer which needs to analyze the superior products: to find the products whose sales values are always among the Top 10 in each state. The sales value data are stored in the sales table, and the main fields are amount, product, and state.

    SQL Solution

    SELECT product
    FROM (
    SELECT product
    FROM (
    SELECT product,RANK() OVER(PARTITION BY state ORDER BY amount DESC) rankorder
    FROM sales)
    WHERE rankorder<=10)
    GROUP BY product
    HAVING COUNT(*)=(SELECT COUNT(DISTINCT state ) FROM sales)

    This type of problems requires running statistics on data group rankings. The currently popular SQL-92 syntax is unable to implement it. Therefore, we use SQL-2003 standard, which is gradually supported by more and more vendors, to achieve this goal. Despite the currently incomplete and imperfect support for SQL-2003, the problem can still be solved. However, the HAVING sub-queries of bad readability are used to compute the intersection of sets. The average developers may find it a bit difficult to understand and leverage.

    esProc Solution


    A1 Cell: Group the data by state, and each group consists of all products and sales volume of a state
    A2 Cell: Compute the Top 10 records of the highest sales value in each group (state) in A1.
    A3 Cell: Based on A2, use isect to compute the intersection of product sets of each group, that is, the top 10 products enjoying the highest sales in each state.

    Comparison

    As we can see in the above example, SQL statements lack the concept of “being ordered” and thus are not fit for this type of analysis relating to serial numbers. Moreover, it is difficult to wade through the SQL statements cobbled together. esProc statements are based on serial numbers and follow the natural pattern of human thought, which empowers the user with a free access to records.

    II Function Description:

    Access with Basic Serial Number

    Get the first three records of sales table: sales([1,2,3]), which is same to sales.m([1,2,3]).
    Get the sales field value of the last record: sales.m(-1).(amount)
    Get the serial number of record whose sales is above 1000: sales.pselect@a(amount>1000)
    Get the serial number of record whose sales is the highest: sales.pmax@a(amount)

    Serial Numbers of Mass Data

    The serial number of mass data is quite common and thus a specific sign of # is assigned to represent it. For example, with the number of clients increase over time, we need to allocate the clients to 2 departments. In order to allocate it evenly, we need to sort the records by client contribution and then group. One group is for clients with odd number, and the other group is for the clients with even number: customer.group(#%2==1).
    The relative number of the mass data is represented with [n]. For example, the link relative ration of sales value increase of this month compared with that of last month:
    sales.(amount-amount[-1]).

    Rank and Sort

    The rank action can be used to compute rankings. For example, to compute the sales value rankings of each record, the esProc user can compose like this: sales.rank(amount).
    The sort action is to arrange the data according to a specific rule for reviewing and further-processing. For example, by sorting the data by the alphabetical order of state names in ascending order, put the data from a same state together. The esProc user can compose like this: sales.sort(state). They can also review the sales value sorted in descending order in each state and compose like this: sales.sort(state,amount: -1).
    Although sorting may disturb the serial number of existing data, sometimes we do need to know the formal serial number of a record after sorting. For example, regarding the three months of the highest sales value in this year, compute the link relative ratio on a monthly basis. In this case, the esProc user can use psort for a much more convenient computation.

    In the Cell A1, records are sorted by month in ascending order.
    In the cell A2, sort the data by sales value and compute the serial numbers, then get the first three serial numbers. At this time, psort is a “mimic” sorting, and the formal sequence of record in A1 is not changed. This equals to “Let’s find out the formal serial number of the newly sorted data in the old data sequence by supposing such sorting was already implemented”.
    In the cell A3, retrieve the record from the formal data according to the resulting serial number from A2, that is, the top 3 months of the highest sales volumes. At last, execute the “this month subtract previous month” computation to obtain the final results.
    The same computation will be a great challenge to SQL. As for the intuitive and convenient esProc, it is just a piece of cake.

    III Advantages

    Convenient to Locate, Rank and Sort

    The data in esProc are all ordered, offering the underlying natural support for the locating, ranking, sorting, and other statistics computations of this type.

    Easy to Handle the Complex Computation

    In the practical data analysis, a great number of complex computations are related to data order. Compared with esProc, SQL lacks the concept of order, and the order-related computation is comparatively harder for SQL to handle.

    Fit for Mass Data Computation

    Regarding the mass data access by serial number, both esProc and senior language can implement it, but this is impossible for SQL. Although the senior languages allow for record access by serial number, they are by no means convenient once compared with esProc. Just name a few, the esProc user can represent the serial number so easily and access to multiple records by a set of serial numbers in a quite simple way. esProc also provides lots of other similar convenience to implement the mass data access additionally.

    Leave a Reply

    if you have any questions, please feel free to leave your ideas below by comments.

    August 8, 2012

    esProc vs SQL: Dissociative Record

    Here we will show an example about how SQL and esProc to express the same case on dissociative record.

    Example:
    Firstly, find out the age of Tom;
    Then, find out how much Tom is older than David;
    Finally, find out how many days Tom’s on-boarding is earlier than Harry’s.


       SQL Solution:


       esProc Solution: 

    In order to simplify the SQL statement as much as possible in the comparison examples, the window functions of SQL 2003 standard are widely used, and accordingly the Oracle database syntax which has best support for SQL 2003 is adopted in this essay.