Showing posts with label crosstab. Show all posts

August 11, 2015

esProc Assists Report Development – Crosstab In Which Row & Column Headers Are Intervals

It is difficult to deal with some unconventional statistical tasks using the reporting tool, like Jasper and BIRT, alone or SQL. One example is the crosstab in which both the row headers and column headers are intervals, and whose measurement comes from anther database table. With powerful structured data computing engine and being integration-friendly, esProc can conveniently handle the case. I’ll explain the process of realizing dynamic data source through the following example.

account_no is the primary key of table account_detail, which has a one-to-many relationship with both table Paysoft_result andNAEDO through foreign key custno and foreign key customer_code. Report design requires that, according to the external parameters, empirica_score field of table account_detail be divided into segments that are used as the row headers and thatmfin_score field also be divided into segments that are used as the column headers. The computation of measurement is to divide the number of records of table Paysoft_result to which the account_no, which is the intersection-point where row headers and column headers meet, corresponds by that of table mfin_score to which it corresponds.

The following figure shows relations between the database tables and between certain fields and the report:

esProc will perform the data preparation using the following code:

A1=myDB1.query("select * from account_detail order by empirica_score,mfin_score")
This line of code retrieves data from table account_detail. myDB1 is the data source name that points to the database. queryfunction executes the SQL query statement. A1’s result is as follows:

A2=myDB1.query("select * from paysoft_result")

B2=myDB1.query("select * from NAEDO")

Then retrieve data from paysoft_result and NAEDO respectively in A2 and B2 likewise. Results are shown separately as follows:

A3=rowList.array()

B3=colList.array()

These two lines of code convert the parameters passed from the report into esProc sequences. Parameter rowList represents the row headers, like “560,575,585,595,605,615,625,635,645,654,665”, which includes ten consecutive intervals; parametercolList represents the column headers, like “39, 66, 91, 116, 137, 155”, which includes five consecutive intervals. array function is used to convert a string separated by commas into a sequence. The converting results are as follows:

A4=A1.select(empirica_score>=A3(1) && mfin_score>=B3(1))

In this example certain data in the source table exceed the range of the specified interval. For instance, customer “No501”’sempirica_sore is 540, which is smaller than the lower limit of the interval – 560. This line of code will filter out the data that are smaller than the lower limit in order to increase performance and simplify the expression.

select function executes data query or data filtering. empirica_score is a field of A1, A3(1) represents the first member of A3, i.e. 560, the lower limit of the interval. The logical operator “&&” means “AND”. A4’s result is as follows:

A5=A4.group(A3.pselect(empirica_score<~[1]):row,
  B3.pselect(mfin_score<~[1]):col;
  ~:accounts,
  A2.select(accounts.(account_no).pselect(~==custno)):p,
  B2.select(accounts.(account_no).pselect(~==customer_code)):n
)       

This line of code groups table account_detail in A4 according to the intervals in A3 (rowList) and those in B3(colList) and find out each group’s corresponding records in A2(paysoft_result) and B2(NAEDO).

group function is used to group data according to multiple fields (or grouping criteria). The syntax is A.group(field1,field2…). It is also used to compute subtotals or perform subsequent computations based on each group of data. The syntax isA.group(field1,field2… ; subtotal1,subtotal2…) . Fields of the grouped data can be renamed with “:new name”. The result of the above grouping operation contains five fields, which are row, col, accounts, p, n respectively. A5’s result is as follows:

To compute the grouping criterion row: Group A4’s empirica_score field according to A3’s intervals using the codeA3.pselect(empirica_score<~[1]). pselect function finds the sequence numbers of the eligible members in A3. “~” represents the current member of A3, ~[-1] represents its previous member and ~[1] represents the next one. The current interval is(empirica_score>=~ && empirica_score<~[1]). As all values of account_no field are bigger than the lower limit of the interval, the expression can be simplified as empirica_score<~[1]. According to “560,575,585,595,605,615,625,635,645,654,665”, A1 can be divided into 10 intervals - 560-574,575-584,585-594,595-604,605-614,615-624,625-634,635-644,645-654,655-664 – whose sequence numbers are from 1 to 10 in order.

To compute the grouping criterion col: Similarly, group A4’s mfin_score field according to B3’s intervals with the codeB3.pselect(mfin_score<~[1]). According to “39,66,91,116,137,155”, A1 can be divided into 5 intervals - 39-65,66-90,91-115,116-136,137-154 – whose sequence numbers are from 1 to 5 respectively.

Summary field account directly gets each group of data. “~” represents members of the current group. Click on accountscolumn highlighted in blue and the detail data will be displayed. For example, as the following figure shows, “row=1,col=1” corresponds the two intervals “560-574 and 39-65”; “row=2,col=5” corresponds the two intervals “575-584 and 137-154”:

To compute the summary field p: Find out records corresponding to accounts from A2 using the code A2.select(accounts.(account_no).pselect(~==custno)). select function accesses A2’s data and selects the eligible data by the filtering criterion. In the case of “row=1,col=1” and “row=2,col=5”, the records corresponding to column p are shown separately as follows (the relationship between accounts and A2 is one-to-many):

To compute summary field n: Similarly, find out records corresponding to accounts from B2 using the code B2.select(accounts.
(account_no).pselect(~==customer_code)). In the case of “row=1,col=1” and “row=2,col=5”, the records corresponding to column n are shown separately as follows:

A6=A5.derive(p.count():pCount,n.count():nCount)

This line of code appends to A5 the new columns pCount and nCount for computing the number of records of p and n in each group. The result is as follows:

A7=A6.derive(pCount/nCount:rate)

This line of code appends column rate to A6. The arithmetic is dividing pCount by nCount. The result is as follows:

A8=A7.run(string(A3(row))+"-"+string(A3(row+1)-1):row,string(B3(col))+"-"+string(B3(col+1)-1):col)

This line of code converts the sequence numbers in row field and col field into the corresponding intervals. run function performs the same computation on every member of A6 (a member is a row, where, for instance, row=1 and col=1). stringfunction converts a number into a string. The expression “A3()” gets A3’s members by their sequence numbers, A3(1), for instance, is 560. A8’s result is as follows:

The result of A8 contains the three fields the report requires. Then we only need to combine them into a new two-dimensional table and return it to the reporting tool through JDBC interface. This job will be done in A9 with the code result A8.new(row,col,rate).

new function retrieves the specified columns (or computed columns) from A8 to create a two-dimensional table. The result of executing A8.new(row,col,rate) is as follows:

Note: esProc provides the operator parentheses to compute the expressions separated by commas in order and return the last expression’s value. With the parentheses, the code from  A4 to A7 can be encapsulated into a single line:

A4=A1.select(empirica_score>=A3(1) && mfin_score>=B3(1)).group(
         A3.pselect(empirica_score<~[1]):row,
         B3.pselect(mfin_score<~[1]):col;
         (accounts=~,A2.count(accounts.(account_no).pselect(~==custno)) /
       B2.count(accounts.(account_no).pselect(~==customer_code))):rate
)

The result is as follows:

A9 is the data set the reporting tool needs. Now let’s design a simple crosstab with JasperReport in the following template:

Three points should be noted: Don’t place the crosstab in the detail band; configure the property of Data Pre Sorted as true; define parameters corresponding to those in the esProc script in the report, such as pRowLlist and pColList. A preview of the report is as follows:

The reporting tool calls the esProc script in the same way as that in which it calls the stored procedure. Save the esProc script as, say unregul.dfx, to be called by unregul $P{pRowList},$P{pColList} in JasperReport’s SQL designer. See related documents for detailed integration solution.

August 10, 2015

esProc Assists Report Development – Transpose Operation for Crosstab Creation

It’s difficult to handle unconventional statistical tasks using simply the reporting tool, like Jasper or BIRT, or SQL. One of the cases is that the source data don’t meet the crosstab’s requirements and thus need to be transposed for display. Having powerful computing engine to process structured data and being integration-friendly, esProc is very useful in assisting the handling of the case. An example will be cited to explain the transposition for designing a crosstab report.

The database table booking holds the summary data of goods orders in every year with four fields that include the year and three types of order status. Some of the data are as follows:

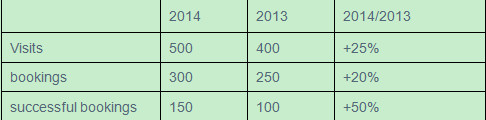
The report table should display the order information of the specified year and the previous one, in which the row headers are the three types of order status and the column headers include years and the growth rate for each order status in the specified year. The measurement is the order data of the current year. The layout and appearance of the report is as follows: 

The difficulty of creating this crosstab report is that the source data cannot be used directly and the values in the summary column need to be computed dynamically based on relative positions. However the difficulty will be significantly reduced if the column and row data in the source table can be rotated and summary values are computed, as shown below:   

Then use esProc code to compute the necessary data for the report: 

A1=yearBegin=yearEnd-1

yearEnd is a user-defined report parameter representing the specified year, such as the year of 2014. A1’s code is used to determine the previous year, which can be defined as yearBegin for the convenience of reference.

This line of code retrieves data of the specified year and the previous one from the database. myDB1, the data source name, points to MySQL. query function can not only execute the SQL statement but accept the parameters. Suppose that the value of yearEnd is 2014, A2’s result will be as follows: 

A3=create(row,col,value)

This line of code creates a table sequence with three fields – row, col and value – to store the transposed data and the summary values. The new table sequence is as follows: 

Note: Similar to the database result set, a table sequence is also a structured two-dimensional table. But its genericity allows a field to have data of different types and its orderliness allows the data being accessed by their sequence numbers. These two features of table sequence are conveniently made use of in implementing this task.


Through accessing the set ["visits","bookings","successfulbookings"] by loop and appending data to A3’s table sequence, this line of code gets data ready for report creation. The working range of for statement, B4-C7, is represented by indentation instead of the parentheses or identifiers like begin and end. Within the working range, A4, the name of the cell where forstatement resides, is used to reference the loop variable. During the first loop, for instance, A4’s value is “visits”.

Now let’s look at the code in the loop body.

B4=endValue=eval("A2(1)."+A4)    

This line of code dynamically retrieves order status data of the first record from A2. eval function can parse the string into an expression. For instance "A2(1)."+A4 will be parsed into A2(1).visits during the first loop and its result is 500. “A2(1)” represents the first record and “.visits” means retrieving the record’s visits field (as shown by the red box in the following figure). 

C4=beginValue=eval("A2(2)."+A4)

Similar to endValue, beginValue dynamically retrieves order status data of the second record from A2. Its value during the first loop is 400.

B5=A3.insert(0,A4,A2(1).year,endValue)

C5=A3.insert(0,A4,A2(2).year,beginValue)

These two lines code insert records into A3’s table sequence. insert function is used to insert one or more records into a table sequence. Its first parameter specifies the position where the insertion happens. If the value of this parameter is 0, then append the record in the end.

During the first loop, for instance, B5 inserts “visits”, 2014 and 500 into the table sequence and C5 inserts “visits”, 2013 and 400 into it. Then A3 becomes this: 

B6=endValue/beginValue-1

This line of code computes the growth rate of the specified year. Its value is B6=500/400-1=0.25 for the first loop.

C6=if(B6>0:"+",B6<0:"-")+string(B6,"#%")

This line of code is used to format the result of B6. The way is to add “+” before the percentage if B6>0 and to add “-” before it if B6<0. C6’s value during the first loop is “+25%”. Note: This step is not indispensable as data formatting can be executed more conveniently by the reporting tool.

B7=A3.insert(0,A4,string(yearEnd)+"/"+string(yearBegin),C6)

This line of code appends new records, such as “visits”, “2014/2013”, “+25%” during the first loop, to A3’s table sequence, as shown below: 

Note that the type of these data is string, which is different from that of data previously inserted.

After the whole loop is executed, all data the report requires will have been appended to A3, as shown below: 

result A3

This line of code returns the result table sequence in A3 to the reporting tool. esProc provides JDBC interface for integrating with the reporting tool that will identify esProc as a database. See related documents for the integration solution. 

Then a simple crosstab will be created with JasperReport, for instance. The template is as follows: 

Define parameter pyearEnd in the report to correspond to its counterpart in the esProc script. The following is the preview of the final report: 

The reporting tool calls the esProc script in the same way as that in which it calls the stored procedure. Save the esProc script as, say booking.dfx, to be called by booking $P{pendYear} in JasperReport’s SQL designer. 

July 9, 2015

Calculate Growth Rate in Jasper Crosstabs

Problem source: http://community.jaspersoft.com/questions/847490/how-get-annual-growth-rate-crosstab

As every column in a crosstab is generated dynamically, you also need to reference them dynamically when performing inter-row calculations. There is some difficulty in handling this dynamic reference using a Jasper script. But the data preparation can be made easier using esProc. Let’s look at an example.

The database table store holds sales amount of multiple products in the year 2014 and 2015. You need to display the sales amount of each product per year using a crosstab and calculate the annual growth rate of every product. Below is a selectin from original data:

esProc code: 

A1: Retrieve records from the store table.

A2: Append annual growth rate of every product to A1. group is used to group data by products; run is used to perform the required calculations by loop; and record is used to append records. ~(i) represents the ith record in the current group. Below is A2’s result: 

A3: Return A2’s result to the report. Reporting tools will identify esProc equipped with JDBC interface as a normal database.

Then you can create the simplest crosstab with Jasper: 

Below is a preview of the finished report: 
A report calls an esProc script in the same way as it calls the stored procedure. Save the above script as AnnualRate.dfx. You can invoke it with call AnnualRate () and input parameters into it from Jasper’s SQL designer.